I'm about to graduate from DigiPen with my masters in computer science, and most of my coursework has revolved around graphics. As my schooling comes to a close, I thought I might keep a blog here about different graphics projects I might be tinkering on in case anyone finds it interesting in some way. Who knows, maybe it will even spark someone's interest in learning more about graphics in games? That would be totally awesome!
Full disclosure: I tend to have as little an ego as possible when it comes to programming in general. I make no claims to being an expert, and totally welcome all comments or criticisms. Well, on to the meat of my first post with my most recent project:
Terrain Generation using the Fast Fourier Transform
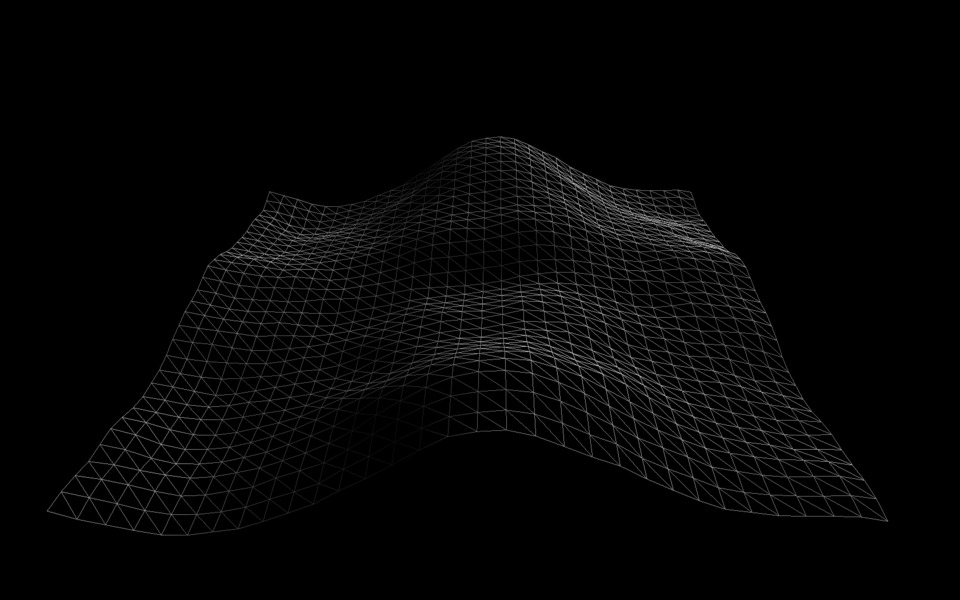
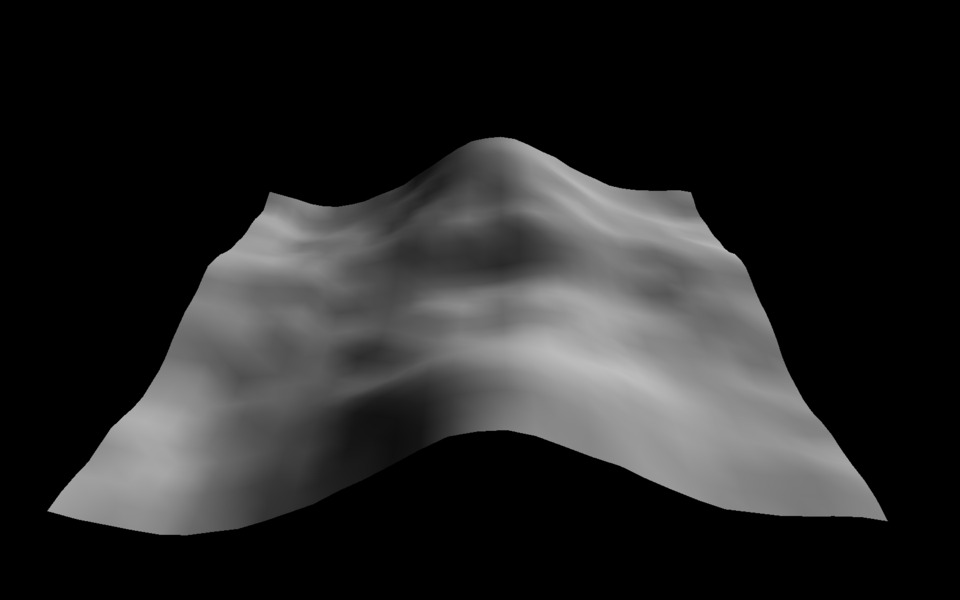
I begin by generating a grid with a dimension of base 2, and spreading it across an area of the same dimension (for now) so that each grid cell occupies a 1x1 area in world space. The height at each vertex is given a uniformly randomly generated number in the range [-1, 1]. Here are the resulting images for the randomly generated heights for a 32 x 32 sized grid plot, shown in both wireframe and shaded view. (All mesh shading shown throughout the blog is just a super basic Phong diffuse, with a single light source)
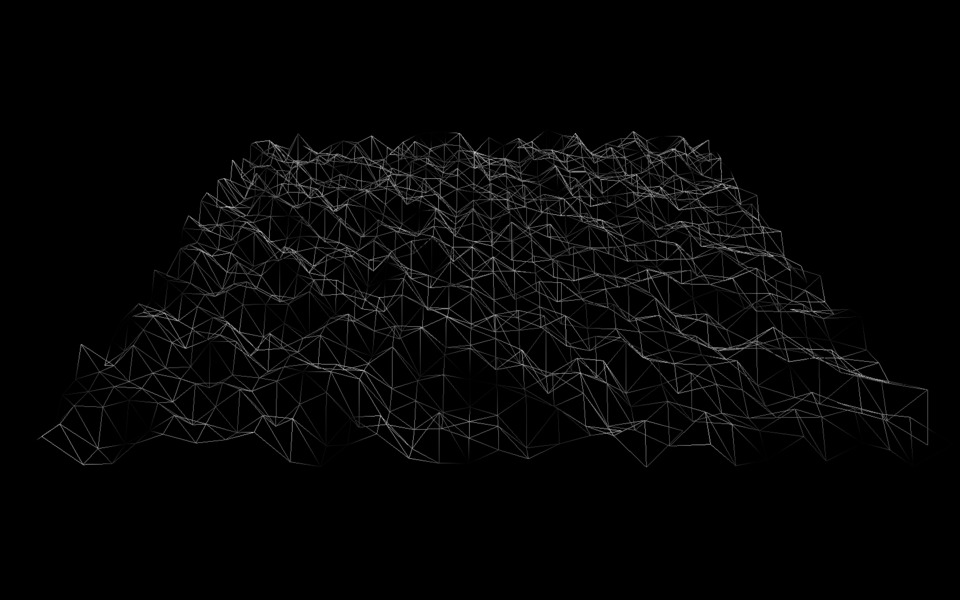
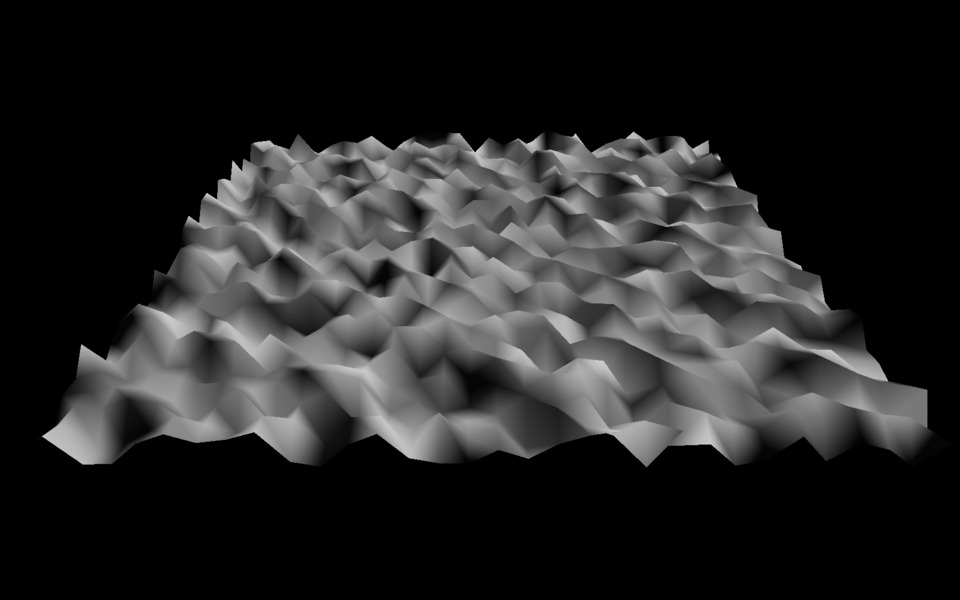
This is where the Fast Fourier Transform is applied. In super simple terms, the FFT is way of smoothing or filtering a set of data. It is often associated with signal processing to filter out certain frequencies in audio. Anyway, we apply the FFT to the 32 x 32 matrix of height data that we randomly generated before. We use the FFT on each row in our grid, followed by applying it to each column. What this has really done is just change the format our data is in...we could just apply the Inverse Fourier Transform to get our original data back, and nothing would have changed. So what we need to do is filter the complex values we have after applying the FFT.
I used what's known as a "pink noise" filter. Again, to super simplify, this is going to take my totally "white noise" random data and filter it based on frequency, effectively smoothing it out. Then after applying the filter, we transform the data back to its original form by using the Inverse Fourier Transform (this time columns first, then rows). Here is the same set of random data from the images above, after the pink noise filter has been applied.
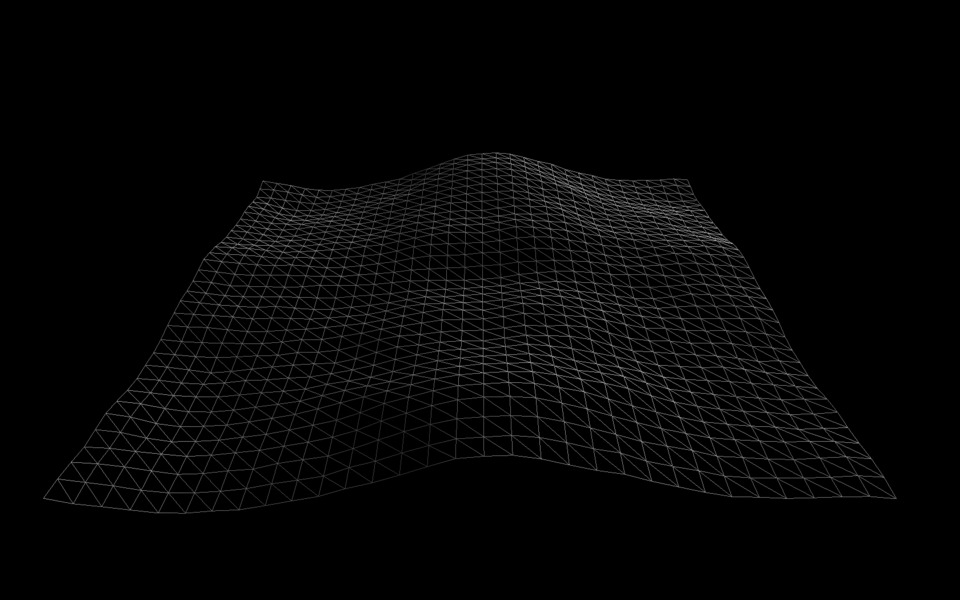
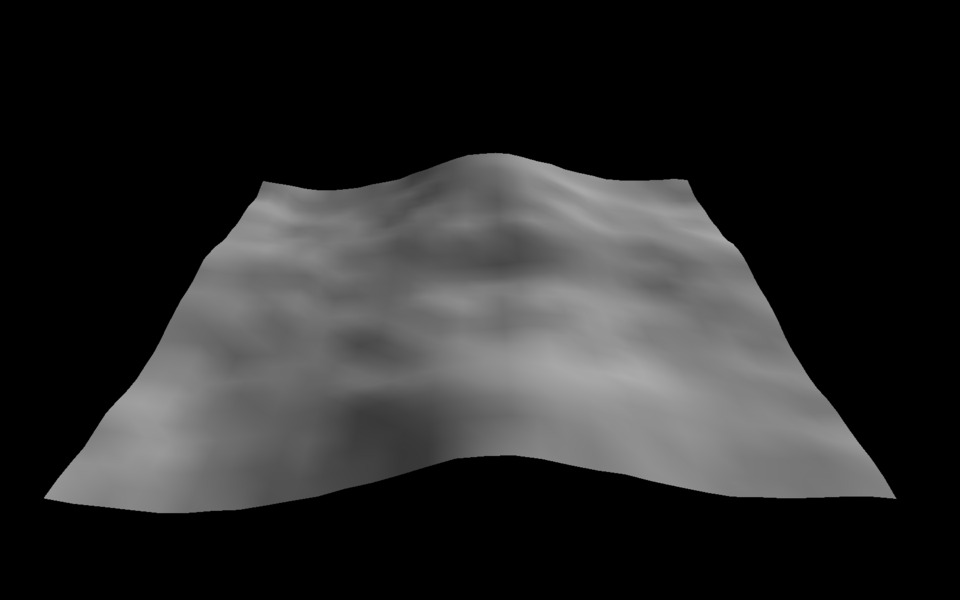
The pink noise equation has two factors that can be adjusted to change the scale of the output. Oversimplifying: an 'Alpha' and 'K' value control the macro/micro (respectively) scale of the outputs curvature. Here is another example of the same data we've been using this whole time, but with the 'Alpha' and 'K' values increased very slightly. This is also a good time to point out that because of the properties of the FFT and pink noise filter, that our resulting data becomes periodic (meaning that if you copied this terrain plot repeatedly and tiled it next to itself, the edges would align and create a single connected mesh).
This is all well and good, but there is only so much detail you can get with a working grid of 32 x 32. Time to pump things up a bit! By increasing the grid dimension to 512 x 512, and compressing the mesh into a world space area of 256 x 256, we'll start to get a lot more visual complexity. The first gif shows what adjusting the 'Alpha' and 'K' values of the pink noise filter looks like, and the second shows a lot of randomly generated terrain plots being generated in succession.
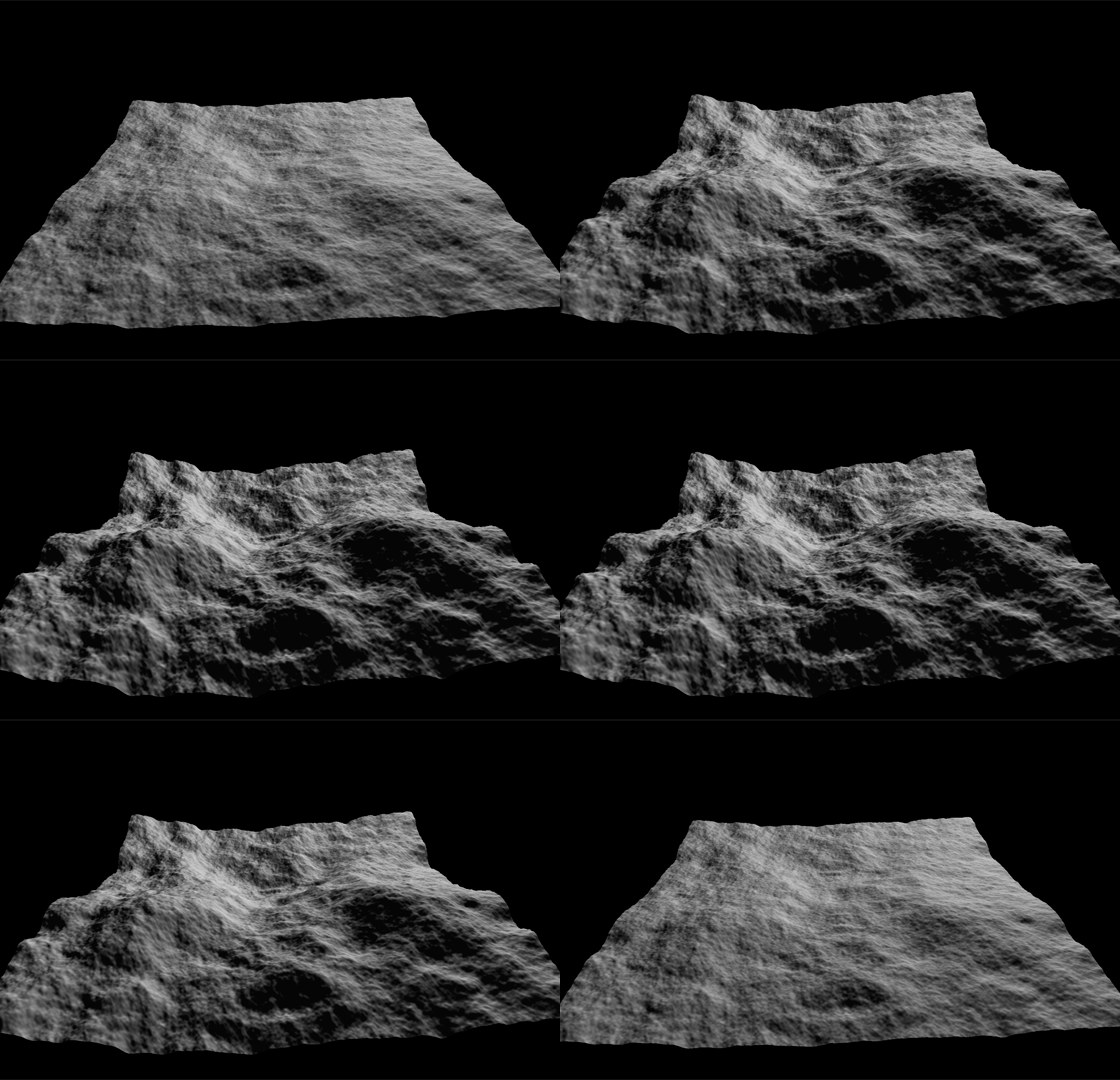

At 512 x 512, these terrain plots are still being generated practically instantly at the press of a button. However, we can go even further. Lets keep the actual surface area of our terrain plot to 256 x 256 in world space, but lets jack up the dimensions of the grid to 2048 x 2048. These take about 1.5 - 2.0 seconds to generate (including the vertex normals), but the explosion of detail is not insignificant.

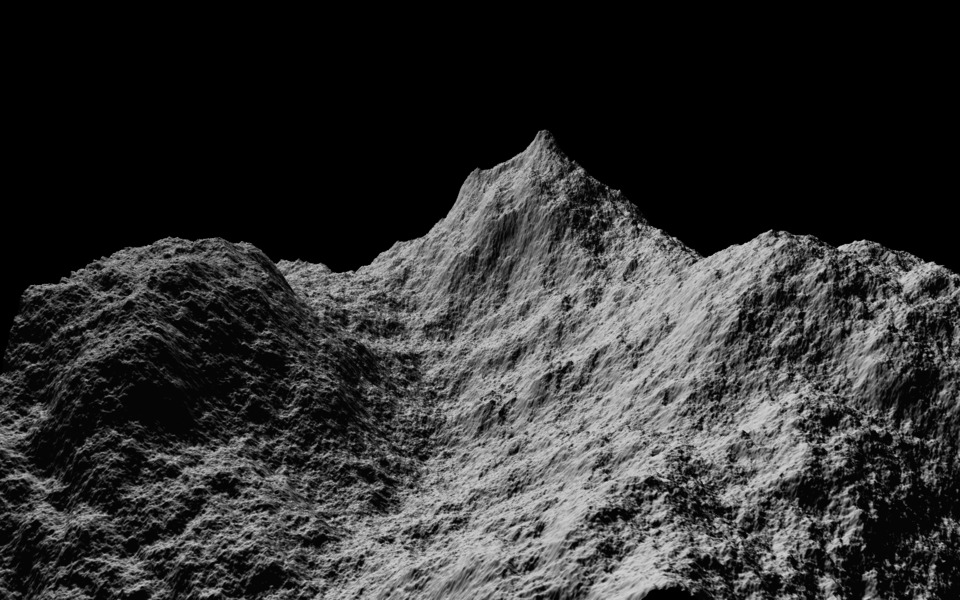
Man, all this came from a completely randomly generated set of heights, all in the range [-1, 1]!! Math is awesome! There are a still a few other interesting observations though. Remember how our 'K' value for our pink noise filter basically corresponds to the micro level control of the smoothness of the terrain. If I take 'K' to it's lower extreme, say 0.000000001, and pump 'Alpha' up to around 5.0 - 5.3 or so, we start to get a really smooth mesh that preserves the large crescendos. It almost starts to look like cloth that's been draped over something. The following gif shows a few iterations with these values.
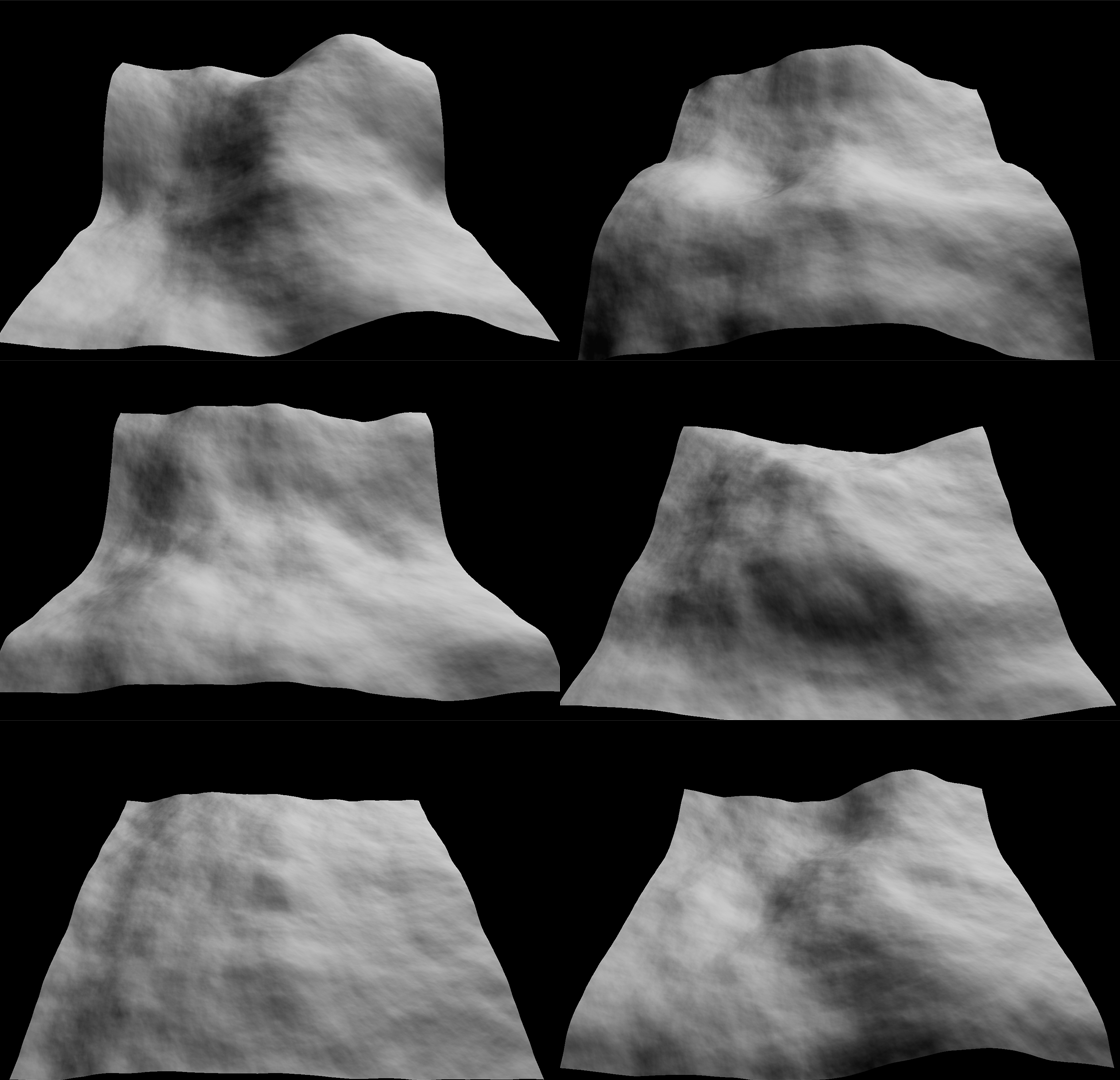
Finally, here is a video of the generation of a 1024 x 1024 grid plot, still in a 256 x 256 world surface area. The terrain is colored according to the interpolated normal value for each vertex. You'll see how the terrain changes when adjusting the 'K' and 'Alpha' values of the pink noise for a given set of random data, and you'll see a number of new random plots generated in real time. (Any of the shakiness when the wireframe is turned on is due to my video compression, not a performance problem in the application)
Log in to comment